
Every business requires a proper management to make a start, reduce cost per unit and help the organization grow profitably. Management wants more output from its workers as long as its quality is maintained even if they have to pay a little extra for the additional output that they add to the daily production. But unless the productivity of all employees is increased in the same ratio, this ‘excess’ production will only lead to holdups at various machines, causing imbalances and build up of production work. It is important that line balancing is maintained and analyzed from time to time believes Paul F. Bowes, Managing Project Director of Performance for Business Productivity Services Ltd., a manufacturing consultancy firm operating in the UK and Asia supporting the apparel industry.
Pre-Balancing the Line
The process of correctly defining the specification of the garment is fundamental – to maximize efficiency, minimize throughput time and maximize profitability. It is important that this specification must include a method breakdown showing step-by-step manufacture and include an output per operator measured either by quantity, minutes, or a given cycle time. The initial line balance can be calculated using a required output or available time.
Production Line Balancing
Case Study – Ladies Leisurewear Manufacturer, Sri Lanka As is common with many manufacturing companies in Sri Lanka, this company had supervisors that were not well trained, and whose main focus was to chase cut work and accessories to make sure the sewing team always had work. The balancing problems that occurred got gradually worse, until it became necessary to work overtime, put extra people on the team, or move work to another team for completion.
The JAAF team, under my guidance, worked with a model line to improve output through better balancing. Once we had allocated the manual work of ensuring cut work and trims were available to the correct people (cutting room and stores), we worked with the team supervisor to identify problems.
Once production started, it was evident where the problem was. The visual clues were easy to see as the balancing problems were evident wherever a sewing operator at a machine was waiting for work, or where a pile of garments was waiting to be sewn on an operation. We asked the sewers who had no work to stand up at their workplace so that we could immediately see what the problem was with the prior operations. After relayout, we could easily see every machine and their stock of work, so we asked the operator who had with him more than 10 garments, waiting to inform the supervisor so that timely action could be taken.
The supervisor monitored the number of garments with the team and number of garments off the team every 30 minutes, to see if the required number of garments were being fed in, processed through, and taken off the line.
The supervisors were subsequently trained to do a simple cycle time measurement of a sewing operator so that she could see how many garments per hour the operator could stitch. If it became clear that the operator could not reach the required quantity even after being shown the better method, then additional resource was required to be put on the operation to take away any handling, or manual work such as trimming. The I.E. department was also tasked with analyzing the operation to see if any work could be passed to another operation or eliminated.
Line Balancing Analysis charts
In the July issue of StitchWorld, there was an interesting article on the meaning of Measure of Time. While I am sure the debate still rages over some of the definitions in the article, one thing that struck me is something I have been saying to factories since I started as a Trainee I.E. – “Cycle time is more important than standard time as it gives an accurate indication of what can be achieved.”
Balancing charts can be used for simple balancing or as more detailed tools for analyzing work methods, and eliminating non-value added activities.
Case Study 1 – Ladies Leisurewear Manufacturer, Sri Lanka
In the case discussed above, we trained the team supervisor to carry out cycle times on bottleneck operations, and to make decisions on whether to push the operator to achieve the time, add assistants to reduce handling, increase the number of operators, or call for I.E. help to change the method.
The I.E. team was trained to use a balancing chart to ensure all operations could be achieved in the required cycle time, and also for analyzing bottleneck operations.
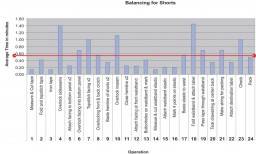
The bar chart 1 shows variation in work content, with the red line showing the average time per operation. This was created from taking the cycle times of every operation. The diagram clearly showed that certain operations like 4, 6, 7, 10, 18 and 23 needed additional operators for a better balance to be achieved.
[bleft] The supervisor monitored the number of garments with the team and number of garments off the team every 30 minutes, to see if the required number of garments were being fed in, processed through, and taken off the line [/bleft]
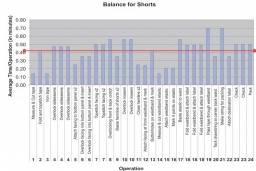
The bar chart 2 shows the balance achieved with additional operators added. If we notice we see multiple operators being appointed in bottleneck operations 4, 6, 7, 10, etc. while no action was taken on operations 5, 9, 11, etc. It was because the trimming was added to these operations to balance the time from another operation.
The production output from the 32-operator team averaged 92 pieces per hour, even after balancing up some of the above operations with additional operators; the average output was at 110 pieces per hour.
The I.E. department with the JAAF team tackled all those operations above the red line (average time per operation), and those operations with little work content.
Operation 1 and 3 – join together
Operation 8 – removed trimming and added to operation 9
Operation 10 – removed trimming and added to operation 11
Operation 12 and 16 – join together
Operation 14 and 15 – join together
Operation 17 – improved the handling
Operation 19 – add an operator
Operation 21 – add an operator
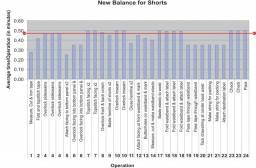
The result of the changes (shown in the balancing bar chart 3) was decrease in number of operators from 32 to 31 and an increase in output to 115 pieces per hour; an increase in productivity of 29% based on output per operator. The balance was still not ideal, but was improved and could be improved further with more study.
Case Study 2 – Contourline, Sri Lanka
Contourline makes sportswear products and is a great example of implementing lean and agile manufacturing practices. The management team, under a strong leadership, has driven major changes in flow and pull of work.
One of their major achievements was to set up a sewing team working to a takt time on all operations. The balancing chart was used to analyse the details of each operation (bar chart 4) to ensure that every operation could be achieved in less than the takt time required.
Thread breaks, bobbin changes, and other occasionally occurring elements were added to the cycle time and 5-10% extra time per operation was added for variations in material, speed, handling, and unforeseeable interruptions.
The detail of the balancing chart makes it easy to see which operations need to be checked, split, or joined, and also where the attention needs to be applied – on the pick up and alignment of work, machining, or check, trim and placing work aside.
The operations are performed in linear sequence, i.e. operation 4 is performed after operation 3; operation 15 is performed after operation 14, and so on…
Operation 4 was allocated the trimming from operation 3. The trimming was of thread ends related to the operation, not separation of the garments, for example, the thread ends left after stitching the waistband.
Operation 6, 7, 8, 9, 11, 12, 14, 18, 19 – an operator was added.
Operation 15 – was allocated the trimming from operation 14.
Operation 21 – the handling was changed to present the work for operation 22 in a way that reduced the handling on Operation 22.
[bleft] The I.E. team was trained to use a balancing chart to ensure all operations could be achieved in the required cycle time, and also for analyzing bottleneck operations [/bleft]
The outcome (as shown in bar chart 5) was a sewing team where every operator completed their work in less than the takt time required, and worked with a single piece flow from operator to operator. The output was a predictable one piece every 27 seconds (0.45 standard minute takt time) which meant 133 pieces per hour. There was no re-balancing carried out unless an operator could not achieve the takt time.
The takt time (red line in bar chart 5) is the rate of production required to meet the customer schedule of demand. In this case the customer order was divided by the number of production days available to give a required rate of 1100 pieces per day. The takt time was calculated by dividing the working minutes (9 hours x 60 minutes) by the required output.
Takt time = (9 x 60)/1100 = 0.49 minutes
Therefore every 0.49 minutes a garment needed to be produced. To give a little bit of security, the takt time was set at 0.45 minutes, which means the output (with 0 delay time) was 1200 pieces per day, allowing for a loss of 100 pieces per day if any unexpected problems occurred.
Conclusion
The initial balance and continual re-balance of lines is one of the most critical jobs for ensuring flow of production. It is not an activity that can happen only once and then be ignored for the production run, unless you are running a one piece flow based on takt time. Every team supervisor must be trained to check cycle times and assess whether sewing operators are capable of achieving the time and quality required. Decisions can be made quickly using this simple tool.
Balancing charts can be a great tool for analyzing problems and balancing lines, but it takes some time to collect the cycle times of every operator. Supervisors need to start with monitoring line input vs. line output to see if there is an imbalance, then look for the operations with lots of work. Cycle checking can then be used to help deal with the bottleneck problems of balancing.
Post a Comment